Have you ever invested via time travel? Calculated how much money you would possess had you known the financial future?
I confess to such a daydream. It is February 1975, my parents inquire what I wish for my birthday, and I respond, “As much Berkshire Hathaway stock as you can buy for $1,000, please.” (That would have been $985 more than the actual value of my birthday present, but never mind that detail.)
That transaction would have netted 25 shares. With Berkshire Hathaway shares now trading at $300,000, that 14th birthday gift would be worth a cool $7.5 million. Thanks, parents.
Frightened by foresight
If that daydream proved real, nothing so far in my life would have changed. To be sure, that Berkshire stock would look splendid in my retirement account, but that’s where it would reside.
Let’s jump to 1989, when I proposed marriage. Rather than borrow from my boss to buy a small engagement ring, as actually occurred, I could have purchased a big ring by selling one Berkshire share. But who could make such a trade, knowing that would be $300,000 of future money? Not I.
Regret would have protected my shares. Whether that would have been an entirely good thing is debatable. Aesop preferred winter’s ants, but there is much to be said for the summer joys of the grasshopper. However, such thoughts lie outside the scope of this column. It concerns investments—and for those, regret would unequivocally been a benefit.
Of course, daydreams being just that, we cannot perceive what is to come. We do not experience that version of regret. What we encounter instead is unhappiness about what might have been—the regret that arises from lamenting the past. That emotion, too, can be helpful.
This got me thinking: How did Berkshire’s equity appear back in 1975 to investors who weren’t time travelers?
Warren Buffett gained control of Berkshire Hathaway in May 1965. EXHIBIT 1 depicts the value of a $10,000 investment over the next five calendar years, from 1966 through 1970. For comparison’s sake I included the S&P 500 and the price change of a barrel of crude oil. (The latter two investments are theoretical: There were no index funds, and oil barrels came with storage costs.) All figures are adjusted for inflation.
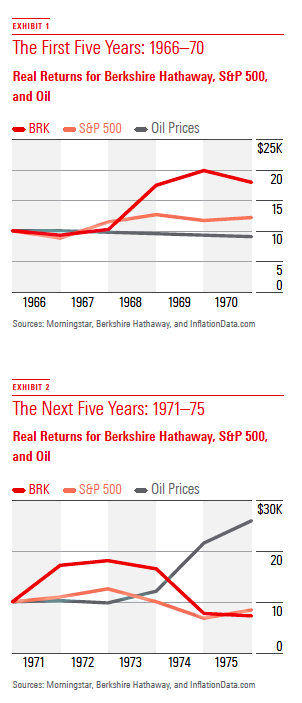
The S&P 500 was modestly ahead after two years, but then Berkshire gained 70% in 1968 and never looked back. It was more volatile than the index, to be sure, but volatile in the right direction. For their part, oil prices languished. Each year they gained slightly in nominal terms, but after inflation was considered they dropped. This was five straight years of (admittedly modest) losses. At that point, if forced to choose between the three options and given no more information than the past returns, most investors surely would have selected Berkshire. True, the company had only a 5-year history under current management, and holding its stock was riskier than owning an index’s basket, but the returns were high enough to overcome the objection. Crude oil, of course, could easily be ruled out.
Onto the ‘70s
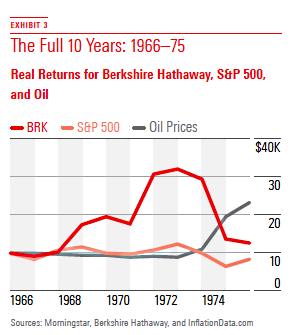
Fast-forward through the next 5 years (EXHIBIT 2). Boy, did things change. Berkshire began where it had left off, by appreciating 73% in 1971. Then came the collapse. After a slight gain in 1972, Berkshire dropped modestly the next year, shed 54% (!) of its value in 1974, and ended the period by losing once again. In real terms, that whippersnapper Warren Buffett turned $10,000 of January 1971 money into just under $7,200. The Oracle of Omaha indeed! More like the Numbskull of Nebraska.
The S&P 500 wasn’t a whole lot better, but at least it finished above Berkshire, and with less (although still significant) turbulence. Meanwhile, crude oil was terrific. After two more years of coasting, it surged from 1973 through 1975, turning a $10,000 hypothetical investment into almost $26,000. It completed the period worth more than the other two choices combined.
This brief tale is a contrarian’s delight. The first period’s winner became the next period’s loser, while its loser turned into its winner. (The middle child, the S&P 500, remained as such.) In addition, the second chart directly addresses the initial question of how the stock appeared to 1975’s investors: dangerous. This company could lose money in a hurry—and did.
The full picture
To which it may (and should) be objected that 1975’s buyers weren’t limited to five years’ worth of data. They would not only know what transpired over the previous half decade, as shown in the second chart, but what occurred during the first chart as well. They would have not been well served by making investment decisions based on each five-year period. Perhaps examining the full 10-year totals, by combining the two charts, would lead to better insight (EXHIBIT 3).
Not entirely. For the decade, Berkshire notched a modest real profit of just over 2% annually (30% cumulatively), while the S&P 500 lost money. Aggressive investors might have selected it rather than a market portfolio. On the other hand, Berkshire’s shares had bounced around heavily, enough to make the S&P 500 the superior choice for risk-aware buyers.
The bottom line is, after 10 years of Buffett’s management, Berkshire’s stock market performance suggested few hints of his genius. Yes, Berkshire had twice surged by more than 70% in a calendar year, but its best result among the eight remaining years was a 13% gain, and it had lost money on five of those occasions. Today, Berkshire is regarded as the closest thing to an investment machine, appreciating year after year, decade after decade. The stock was not like that back in the day.
By the Book
There was a clue for the observant, though: the company’s book value. Investors of course can’t purchase a company’s book value; they must instead buy its publicly traded shares in the expectation that over the long haul, the company’s stock price will move in tandem with its book value. That has indeed occurred with Berkshire Hathaway, which at its 50-year anniversary reported a 21.6% annual nominal gain in its stock price, and 19.4% growth in its book value. (The S&P 500 was at 9.9%).
Over shorter periods, however, the stock may disengage itself from the book price. That was certainly the case for Berkshire. This column’s fourth and final chart repeats the previous effort, but with the addition of the real change in the company’s book value (EXHIBIT 4 ). This time, we have a winner! The book value clearly beats the three alternatives. It has by far the steadiest performance and misses by a whisker of also posting the highest cumulative gain.

Lessons from this exercise:
1 By all means, don’t make decisions based on 5-year returns. You knew that already, but it’s worth pointing out that many mutual fund trades continue to be driven by 5-year results.
2 Ten-year totals are better, but still imperfect. From 1966 through 1975, the most successful investment manager in the public markets looked ordinary. Granted, that was his single worst 10-year stretch; every other early decade would have yielded different conclusions. But then again, Buffett has been the very best. Lesser managers would suffer more down periods.
3 Book-value growth judged Buffett’s quality better than did share-price performance. Unfortunately, we can’t extend that insight, because Berkshire Hathaway isn’t structured as other investment funds are. It calculates a book value, while they do not. (Net asset value has certain properties that are similar, but it is not a match.) Ah, well. Not every finding can be generalized.
A more detailed version initially appeared on Morningstar.com