The yield curve seems to have instilled terror into the hearts of all. Since the inverted yield curve is the bellwether for an economic recession, its appearance had all the prophets of doom crawling out of the woodwork.
What is the ruckus all about?
A yield curve is a visualization, or graphical representation, of the yields available for bonds of equal credit quality and different maturity dates.
Normally, the yield curve is upward sloping as bond investors expect to be compensated more for tying their cash up for longer periods. The longer the duration, the more the impact of inflation and interest rate risk. Essentially, you're being compensated for investing your money for longer periods of time.
This relationship occasionally breaks as near-term fears mount and bond investors start to demand more compensation for shorter-term loans than longer ones.
An inverted yield curve is when short-term interest rates become higher than long-term rates. Currently, shorter-dated U.S. government bonds are yielding more than longer-dated bonds. Consequently, the yield curve is inverted.
Is this a warning of sorts?
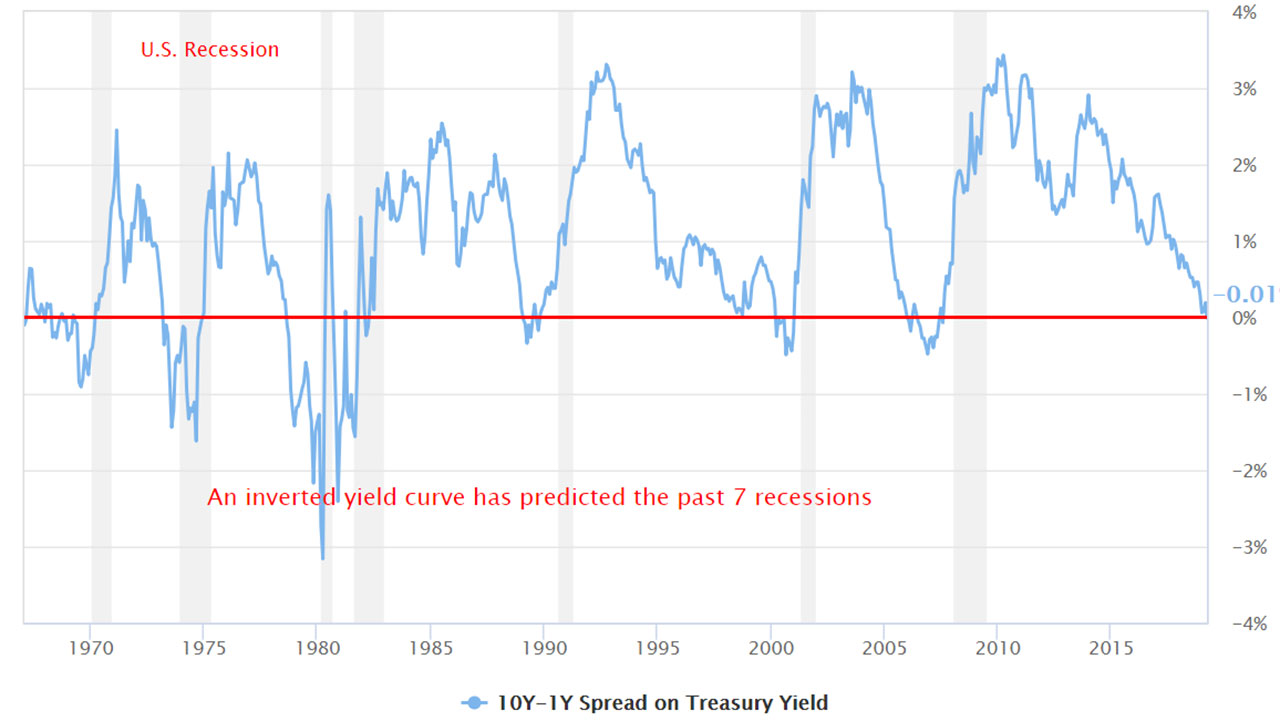
The yield curve has inverted ahead of every one of the past nine U.S. recessions and has thrown in only one false signal in the past half a century, so it’s certainly an indicator to take note of.
Generally, once the curve inverts – the 2-year Treasury bond starts to yield more than the 10-year Treasury bond – it means a recession will occur within the next 12-24 months.
Opinion: Neptune’s Chief Economist, James Dowey
It is the number one recession indicator bar none and right now it’s flashing amber with a hint of red emerging. It’s going to invert over the next six months. A couple more rate hikes from the Fed should do it, and we’re going to be in recession territory.
However, there are reasons to think this time it really is different.
There are two underlying fundamentals that drive the slope of the yield curve. One of them tells you about the chances of a recession, the other has nothing to do with it.
The growth/recession expectation indicator is where the market – through bond futures contracts – believes the short rate will be in 10 years’ time minus where the market thinks the short rate will be in two years’ time. When that component flattens, or inverts, it tells you the market is anticipating that the Fed is going to have to cut rates in the future in order to deal with a recession. That component has come down a bit, but it’s still comfortably in positive territory, whereas prior to previous recessions this factor had dipped into negative territory.
The main driver of the yield curve’s current plunge towards inversion is the second component, the term premium. This is the return investors demand for holding a 10-year Government bond over a two-year Government bond.
What we’ve seen this time around is that it’s the term premium that’s collapsed rather than the recession indicator. (In 2016 too, the term premium turned negative and the yield curve flattened.)
The reason the term premium has flipped and investors are currently demanding more for short-term debt than long-term bonds is quantitative easing.
The bond-buying programme introduced in the wake of the great recession was intended by the U.S. central bank to drive down the term premium and research by Fed economists in April 2017 suggests QE pushed the term premium on 10-year Treasuries down by 100bps. This should reverse over time as the Fed rolls back QE and enters tightening mode.
Source
Opinion: Stefan Kreuzkamp, CIO at European asset manager DWS
In order to compare the current yield curve with historical precedents, one would have to deduct this ‘artificial’ decline in yield’.
First, any analysis looking at the 2-year and 10-year yield differential does not take into account actual interest rate expectations, which the Fed now publishes. We would instead recommend considering a money-market rate, or the central bank’s policy rate directly. The current slope between the fed funds rate and the 10-year bond yield suggests the next recession won’t come around until at least 2022.
Second, there is little precedent for the U.S.’s huge swathe of tax cuts and fiscal spending increases this late in the cycle, meaning it’s hard to assess how they might impact the yield curve.
The most commonly used yield curve would suggest the start of a recession late in 2020. However, we find a lot of objections and, in the current environment, we would be particularly cautious about taking the yield curve at face value.
Source
Opinion: Morningstar head of multi-asset portfolio management, Brad Bugg
Despite all the doom and gloom in markets, global growth still remains reasonable. The expectation is that we'll have growth of above 3% for the next couple of years. But if you look at individual countries that outlook can be quite diverse.
While everyone is expecting slower growth in China, for instance, that economy will still probably grow at above 6%. Whereas if you look at some parts of Europe, growth may be a lot lower, below 1%. But I think what everyone is watching at the moment is the U.S. More recently we've been growing at about 3%, but this could slow to about 2%. It's not necessarily a recession, but it's definitely a weaker environment than what we've been in.
Source