If you are holding multiple funds and wish to quickly check the overall diversification of your portfolio and how it has performed, Morningstar.in offers an easy-to-use feature called Instant X-Ray tool to get insights into your portfolio. This section can be accessed from Mutual Funds tab > Instant X-Ray. Alternatively, you can also access it from Tools > Mutual Funds > Instant X-Ray.
Type the allocation either in percentage or the amount you have invested in each scheme and click Show X-Ray tab. Click on the pdf icon on the right-hand side corner at the top to download the report. You can build a report consisting of up to ten funds. We searched for ten funds with equal allocation to each comprising Large Cap, Mid Cap, Small Cap, Gold, International Funds and Debt Funds. (These funds are for illustration purposes only and not a recommendation from Morningstar).
- Axis Greater China Equity FOF
- Axis Small Cap Fund
- DSP World Energy
- HDFC Gold
- HDFC Mid-Cap Opportunities
- ICICI Prudential Value Discovery
- IDFC Banking & PSU Debt
- Kotak Bond Short Term
- Motilal Oswal Nasdaq 100 FOF
- SBI Bluechip Fund
The Portfolio X-Ray report will have details on your asset allocation, geographic exposure, trailing returns, time period return (best and worst-performing period), sector allocation against the benchmark, investment style, top ten underlying holdings, holding overlap, and more.
Asset Allocation
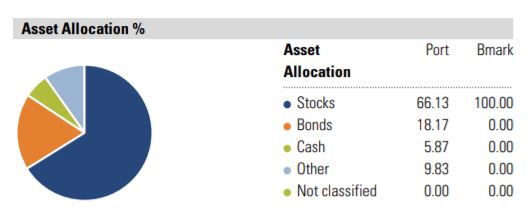
This pie chart and table depict the portfolio's exposure to the following broad asset classes: Stocks, Bonds, Cash and Other. The Other category represents an asset class that Morningstar recognizes but classifies outside of the asset classes listed above. (For example, real estate is typically classified as Other.) Not Classified is for those securities Morningstar does not recognize or track. The tables adjacent to the pie chart identify the net asset allocation percentages of the portfolio, as well as the component long positions (assets) and short or marginal positions (liabilities) of the portfolio.
World Region

This data set provides a broad breakdown of portfolios' geographical exposure, by region and by market maturity. Only non-cash equity assets are evaluated in determining the exposures. Not Classified indicates the percentage of the equity portion of the portfolio for which Morningstar is unable to assess region or origin.
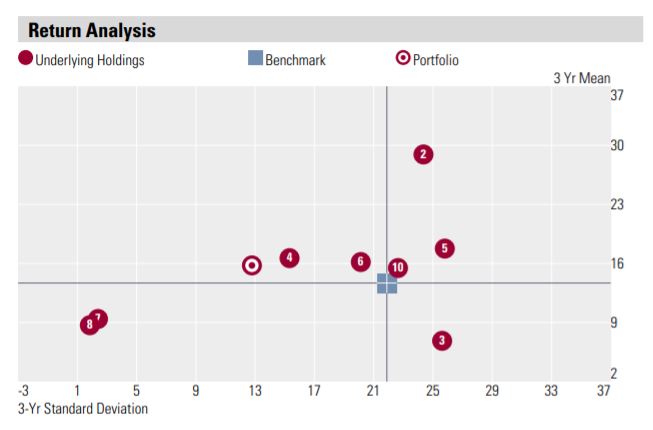
Risk/Reward Scatterplot
The risk/reward scatter plot is based on each holding's risk and return over the most recent three-year period. Risk is measured as 3-year standard deviation of return. Return is measured as 3 year mean return. The risk/reward scatter plot also contains the portfolio's risk and return.
Correlation Matrix
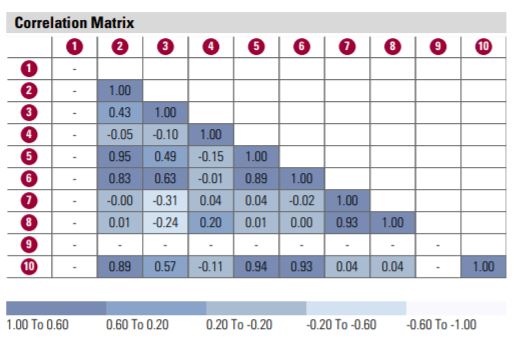
The matrix shows the performance correlation between different holdings. A correlation of 1 indicates the two holdings move in the same direction, a correlation of -1 indicates the two holdings move in opposite directions and a correlation of 0 means that no correlation could be found. A correlation of -1 will offer maximum diversification.
Risk and Return Profile
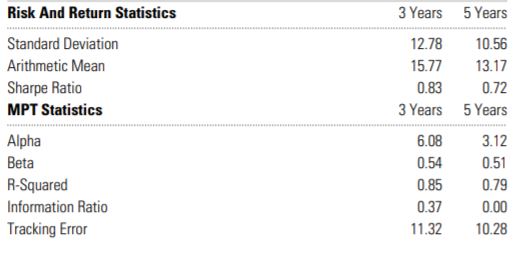
R-squared
It reflects the percentage of a fund's movements that are explained by movements in its benchmark index, showing the degree of correlation between the fund and the benchmark. Beta is a measure of a fund's sensitivity to market movements. A portfolio with a beta greater than 1 is more volatile than the market, and a portfolio with a beta less than 1 is less volatile than the market. Alpha measures the difference between a fund's actual returns and its expected performance, given its level of risk (as measured by beta).
Sharpe Ratio
It is a risk-adjusted measure calculated by using standard deviation and excess return to determine reward per unit of risk. The higher the Sharpe Ratio, the better the fund's historical risk-adjusted performance. The Sharpe Ratio is calculated for the past 36-month period by dividing a fund's excess returns by the standard deviation of a fund's excess returns. Since this ratio uses standard deviation as its risk measure, it is most appropriately applied when analysing a fund that is an investors sole holding. The Sharpe Ratio can be used to compare two funds directly on how much risk a fund had to bear to earn excess return over the risk-free rate.
Standard Deviation
It shows how far a set of values are spread above and below the average for a particular fund type. If the standard deviation is a high number positive or negative then the fund has performed that far below or above the average. If the standard deviation is low then the fund has performed closer to the average.
Mean
It is the annualised performance of a fund over three years.