We have long spoken about the benefits of long-term investing in a volatile asset class like equities, what really matters is “time in the market” rather than “timing the market”. Over the long haul, the stock market's outperformance over cash boils down to just a few critical months. Miss those months and you will have missed all the risk premium to be earned from holding a volatile asset such as equities.
In the 10-year period from July 2009 to June 2019, Indian stocks owed their outperformance over cash to just 8 months, or 6.7% of all months. If you held stocks for all 112 months apart from those 8 months, which we will call "critical months," a term which we will define more precisely below, you would not have beaten cash.
Morningstar India’s fund research team performed the same test against Indian actively managed diversified equity funds to determine if the phenomenon applied to them as well.
We applied this analytical approach to active management with this question: For an actively managed fund that outperformed its benchmark over a given time period, how many critical months accounted for that outperformance?
We find that, on average, less than 7% of the months account for all of the outperformance for Indian actively managed diversified equity funds. Active management turns out to follow the same dynamic as the market as a whole. It is thus natural that the implications for buying and selling actively managed funds should be similar to those regarding timing entire markets.
The implication is that it is exceedingly hazardous to try to time markets. Staying invested is the name of the game, be it in equities as an asset classes or the funds you select to invest through.
Methodology and Data
Critical months are those months whose removal from the return series would eliminate the fund's outperformance over its benchmark.
We find this by calculating geometric excess return of a fund over the category index for all months. Geometric excess returns are multiplicative, so that the geometric excess return over the whole period is the product of all the months' excess returns, so we remove, one by one, the month with the highest excess returns, the second-highest excess return, and so on until no excess return over the whole period remains.
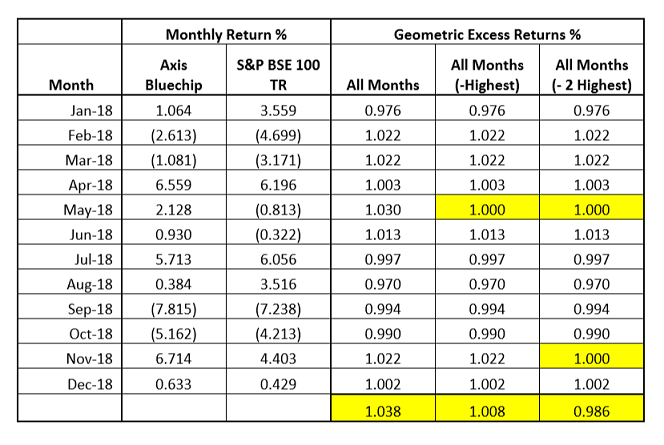
To get a better feel for this idea, we examine a real-life example, Axis Bluechip Fund. Over the 12 months ended December 2018 the fund outperformed its category benchmark, the S&P BSE 100 TR, by 3.82% (in geometric excess return terms, which we show here as 1.0382; outperformance in geometric terms means >1).
The columns titled "All Months" are the geometric excess returns for each month (defined as (1+FundReturn/100)/(1+IndexReturn/100). The bottom row shows the geometric excess return over the whole period, which is just the product of multiplying all the months' numbers above it. In the next column, we remove the highest geometric return, May 2018, keeping all others intact (in geometric terms this removal means setting that month's excess return to 1, as if the fund just matched the index in that month).
We see in the Geometric Excess Return row that the removal of that month's excess return brings down the whole period's (less that one month) geometric excess return to 0.83% (1.0083). However, when we then take the out the second-highest excess return (November 2018), the excess return for the whole period turns negative (0.986 = - 1.35% geometric excess return). This is how we define critical months. Their number is dependent on the time period under consideration. For this particular fund over the 12-month period we considered, the number of critical months was two. These were the two months out of 12 that accounted for all the fund's outperformance of its benchmark.
To see what actively managed funds look like from the critical-months perspective, we conducted a study that used active funds' returns over the 10 -year period from July 2009, through June 2019. There is nothing special about using this particular 10-year period: It was a long enough time frame to measure long-term performance, and it gave us a sizable sample of funds.
We used the following criteria to select funds and their appropriate indexes:
- Unlike the global study we used net returns, since fund fee structures are comparable locally.
- We used the Distributor share class for funds, as these have a longer track record and have a greater proportion of the assets.
- There must be 120 monthly total returns over the period from July 2009 to June 2019. Consequently, the study omits the results of funds that began the 10-year period but did not finish it because they were merged away or liquidated before July 2019. This choice was motivated by the desire to have all returns for all funds over the time period.
- Fund Returns were compared against Morningstar category benchmarks.
- We used only equity funds. We excluded fixed-income and allocation funds because they are sometimes harder to map to an appropriate index.
- Categories considered were ELSS, Large Cap, Multi Cap & Mid Cap.
Results
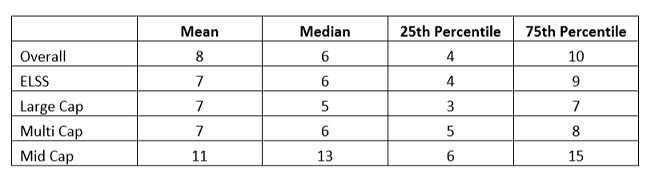
This displays aggregate statistics for critical months, first in aggregate and then grouped by fund category.
One can immediately see that whether it's mean, median, or the top- and bottom quartile breakdowns, these numbers are small and should give little comfort to investors who try to find the best times to buy and sell actively managed funds. In aggregate, the median number of critical months was six. That means that half of the funds' outperformance was due to six or fewer months. One in four funds (25th percentile) owed their outperformance to four or fewer months.
Finally, three fourths (75th percentile) of all the funds' outperformance was attributable to 10 or fewer months. Mid Cap Funds were the best of the pack, while expectedly Large Cap funds came in with the poorest results.
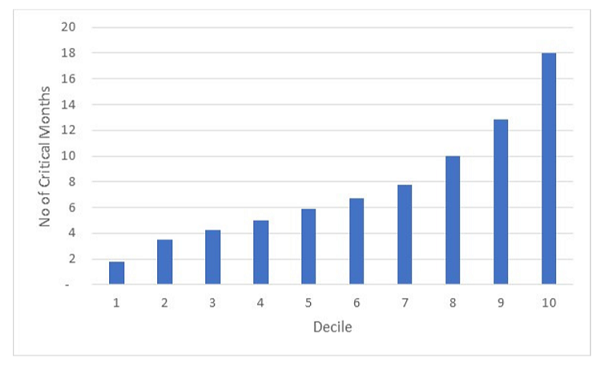
We divided funds by deciles of outperformance and show, in Exhibit 3, how many critical months, on average, each decile had. Even the best decile of outperforming funds, on average, owed their outperformance to just 18 months of excess returns. That is one year and six months out of 10 years.
Summary
In our purely descriptive account of outperformance, we remain agnostic as to what the exact distribution of excess returns is. There is solid evidence that most actively managed funds' excess returns are not normally distributed. But from our perspective the exact shape of that distribution does not matter.
What matters—and this is the most practical implication of our findings—is that trying to find the best time to buy or sell a fund is most likely futile. Most of the time, even outperforming funds basically track or trail the index.
If you think you have identified a skilled manager, the best course of action is to buy in or rupee cost average, regardless of the moment, and hold on to him or her over long periods of time. The obvious, and perhaps even more important, corollary is that a fair amount of patience is required to adhere to such a program. A good manager may take a long time before critical months materialize. Thus, don't sell based on the “what have you done for me lately” rationale. The gospel of wisdom can be adapted to active management: No one knows the day or the hour when outperformance will strike.