Why do so many projects run over budget and behind schedule? Why do financial plans fail? The reason in many cases is what Stanford University professor Sam Savages calls the flaw of averages. The flaw of averages is using a single number (usually an average) in place of an uncertain quality.
The flaw of averages is humorously depicted in this cartoon in which a statistician carries out a plan to walk to cross a river based on knowing that the average depth of the water is three feet, but not considering how much variation there could be in the river’s depth.
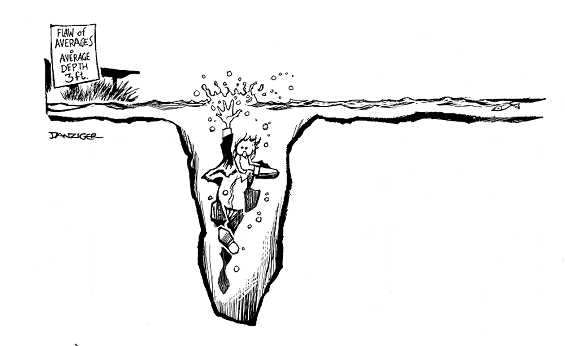
Source: The Flaw of Averages by Sam L. Savage, Hoboken, NJ: John Wiley & Sons, 2009.
A classic case of the flaw of averages is using a financial calculator to decide how much to save each year to reach a financial goal. For example, suppose that you estimate that you need to accumulate $1,000,000 to retire comfortably in 40 years. You can calculate how much you need to save each year.
To calculate this, you need to provide the calculator with a rate of return. Based on historical data, you come up with a rate of return of 6%. You enter the following parameters into the calculator:
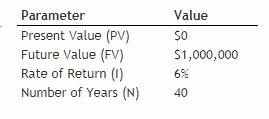
Press the payment (PMT) key and you get the answer: $6,462.
So, what can go wrong? Plenty. First, the realized rate of return on the portfolio may turn out to be significantly less than the average. The risk of the portfolios investments must be considered, just as Markowitz taught us so long ago. Second, its not just the average return that matters, but also the sequence in which they occur. This is called sequence risk. (Caution: there are some websites and publications that state that there is no sequence risk when accumulating for a goal. As I will demonstrate, they are quite wrong.)
Investment risk
The rate of return on any investment portfolio, other than a portfolio that is entirely cash, is uncertain. Any kind of financial planning needs to take this uncertainty into account.
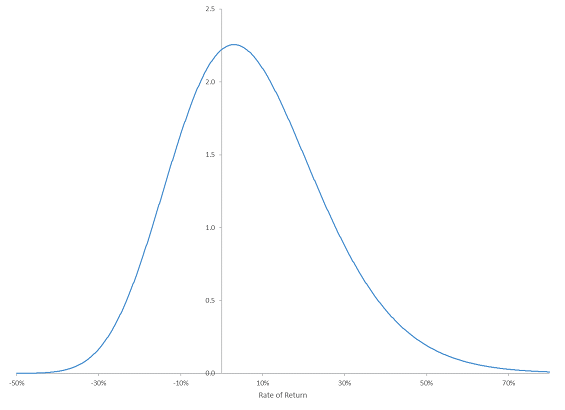
The first step to address uncertainty of returns is to model it. The most common way to model it is to assume that each year’s return is drawn from a probability distribution as shown in the chart below. In forming this distribution, I assumed that there is a 50% chance of each year's return being at least 6%, but with risk similar to that of stock markets in developed countries.
Probability Distribution of Annual Investment Returns
Sequence risk
Even if your investment portfolio produced the average rate of return that you used with the financial calculator, you still may not achieve your investment goal. This is because the sequence of returns matters. To illustrate this, I calculated the ending value from saving $6,462 each year for 40 years under three scenarios:
- A constant 6% return;
- Returns increasing steadily from about -4% to about 17% with a compound rate of return over the 40-year period of 6%; and
- Returns decreasing steadily from about 17% down to about -4% with a compound rate of return over the 40-year period of 6%.
Although under all three scenarios, the compound rates of return are the same, the results differ. In the case of the constant rate of return, the result is right on the money at $1,000,000. But in the scenario with increasing returns, the portfolio surpasses its goal by about $102,000. And in the case of decreasing returns, the final value is about $92,000 short of the goal.
Monte Carlo simulation
Since with risky portfolios, one can never be sure of the outcome of an investment plan, any statement regarding possible outcomes needs to be cast in terms of probabilities. In the example of accumulating assets with the goal of getting to $1,000,000 in 40 years, this means that we should estimate the probability of falling short of $1,000,000, and if we fall short, by how much and with what probability.
Practically, the only way to come up with these probabilities is to use a method called Monte Carlo simulation. This typically involves using a random number generator to create a series of returns that have the same average and risk level of the portfolio, using the simulated returns to calculate what is of interest, such as the value of the portfolio at the end of the period, and repeating this procedure, perhaps thousands of time. The result is a probability distribution, rather than a single number. For example, for the accumulation scenario discussed above, running Monte Carlo 1,000 times, I estimate that there is a 46.5% chance of falling short of $1,000,000 and there is a 16.5% chance of not even reaching $500,000. Furthermore, even if returns over the 40-year period came to the assumed 6%, there is still a 40% chance of falling short.
Of course, different model builders make different assumptions, so the results have to be taken with a grain of salt. But the important thing is that some attempt is made to not fall into the flaw of averages. While individual investors may not have the tools to do Monte Carlo simulation, advisors do. They should put them to use to present probabilities to their clients, not absolutes.
Note: For those who are interested in trying Monte Carlo simulation, probabilitymanagement.org has some excellent tools for Excel-based modelling.
This article initially appeared on Morningstar.ca