Five months ago I read an article on governments across the world plunging into stock investing. It was the last few lines that grabbed my attention.
Stock market nationalism is here. The political wind is blowing in the stock market’s favour. How long this trend lasts may be the investment question of the new decade.
I was aware of populism, nationalism, and economic nationalism. Was “stock market nationalism” something that has been around all the time, but I have never been aware of?
Robert Prechter is as close to it that I got.
Robert Prechter’s theory of social causality called Socionomics surfaced in 1985. The hypothesis is that social mood is the prime regulator of social action. And it is fluctuations in social mood that produces waves of optimism and pessimism.
Social mood is not conscious, rational and objectively reactive but unconscious, non-rational and subjectively active. While people almost universally believe that the character of social events determines social mood, socionomics recognizes that the causality is the reverse: Social mood determines the character of social actions.
Some forums of activity are ideal for the immediate expression of social mood. The one in which the most detailed and pristine data exist is the stock market, where investors in the aggregate buy and sell stocks almost immediately to express changes in their mood.
Many actions taken in response to trends in social mood take time to manifest. For example, business people might decide, in expressing the social mood, to expand or contract operations. But it takes time to implement such plans, so changes in macroeconomic activity lag changes in the stock market. The same is true of political actions, which generally require a large consensus and thereby substantially lag social mood trends.
Hence, sociometers such as the stock market averages are leading indicators of macroeconomic trends and political actions.
Socionomics postulates that waves of social mood are endogenously regulated, fluctuating toward the "positive" (optimistic) and then the "negative" (pessimistic) direction according to a patterned, hierarchical fractal called the Wave Principle, identified as a stock market model by Ralph Nelson Elliott in the 1930s.
Waves have substantial quantitative leeway but adhere to one overall form, under which there are five specific forms and a limited number of variations thereof. Because Elliott waves are patterned, they are probabilistically predictable, thereby making the character of social trends probabilistically predictable as well.
Piyush Chaudhry, trader and founder of Wave Analytics, talks of the Waves of Nationalism. Here he explains it in his own words.
The Waves of Nationalism get reflected in the stock market through stretched valuations over a long period of time.
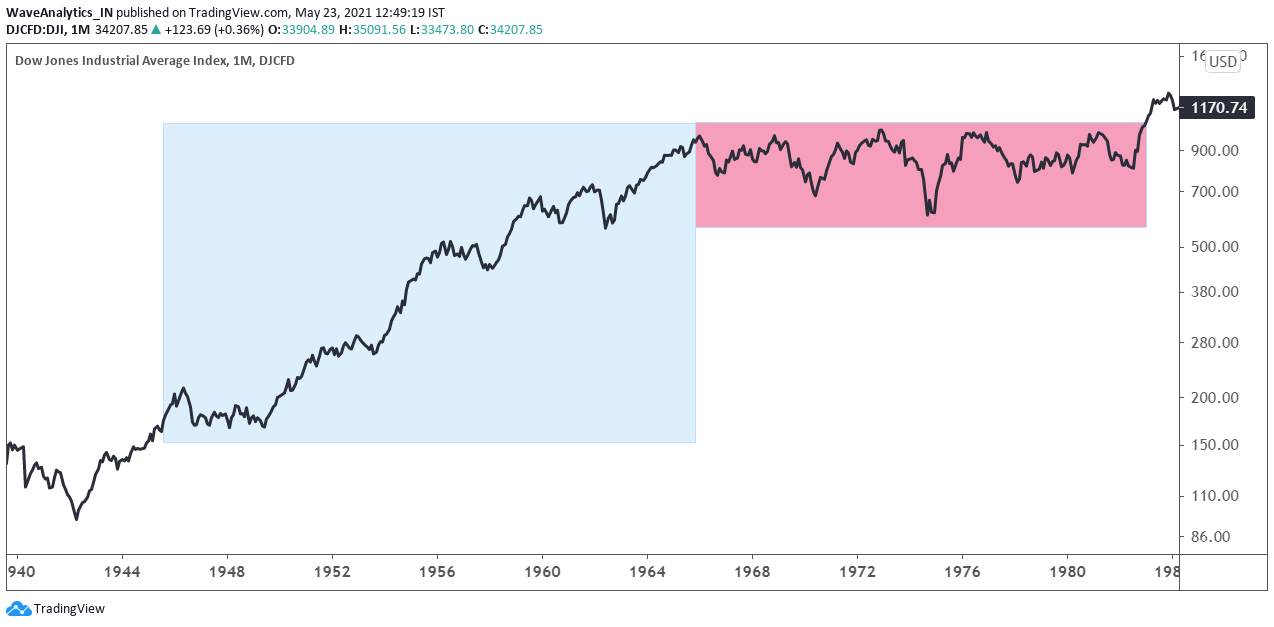
Prior to World War II, the idea of the U.S. as a leading global power was not an ambition of American politicians. By the end of the war, the U.S. stood as one of two leading global powers, alongside the Soviet Union. It established a clear desire among American political and economic leaders to protect this newfound power and to secure the U.S. as the leader of the “free world.” WWII transformed the U.S. a midlevel global power to the leader of the “free world.”
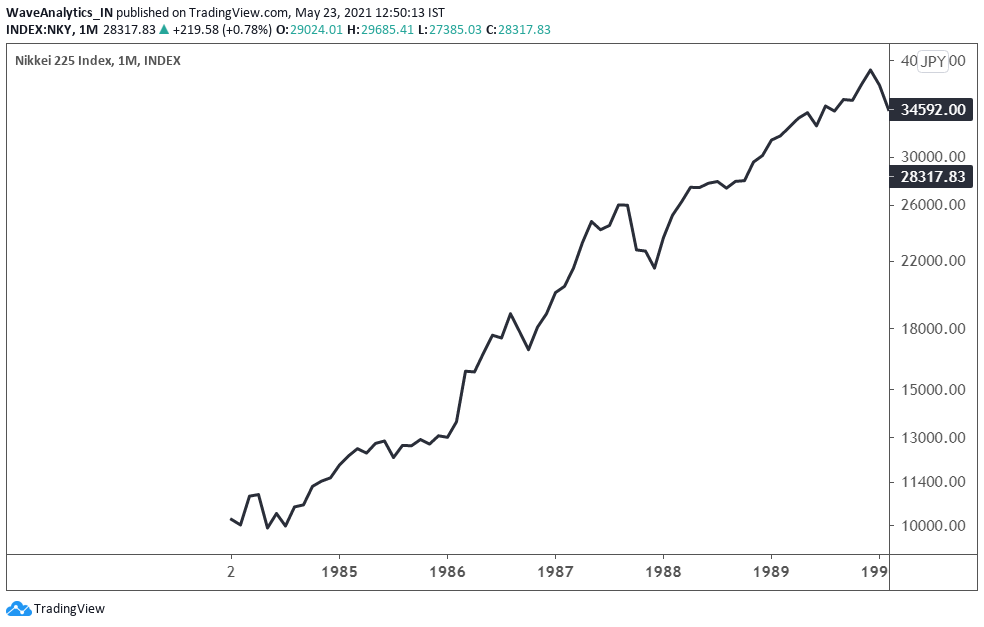
Remember Japan in the 80s? Confidence was high. The stock market was booming. The country had a trade surplus. Japan wore the Electronics Crown. The CS Monitor noted that in 1980, Japanese companies listed on the Tokyo Stock Exchange were earning $425 million each year on technology exports while paying $350 million for technology imports.
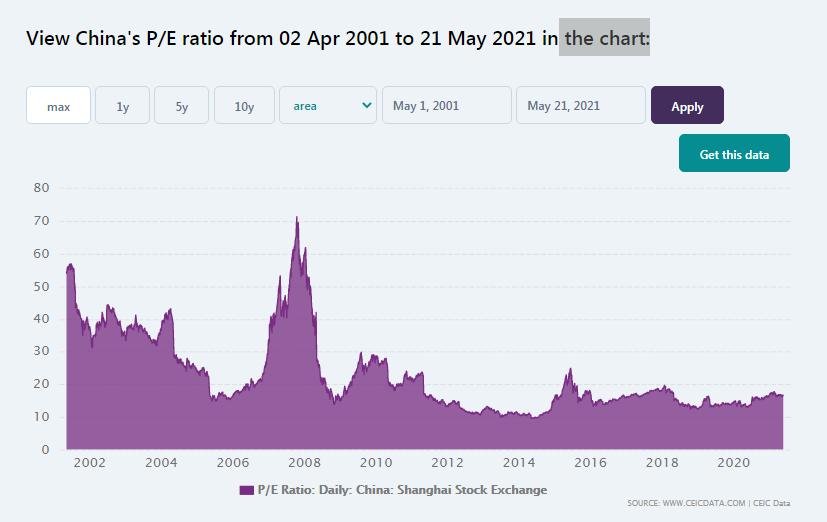
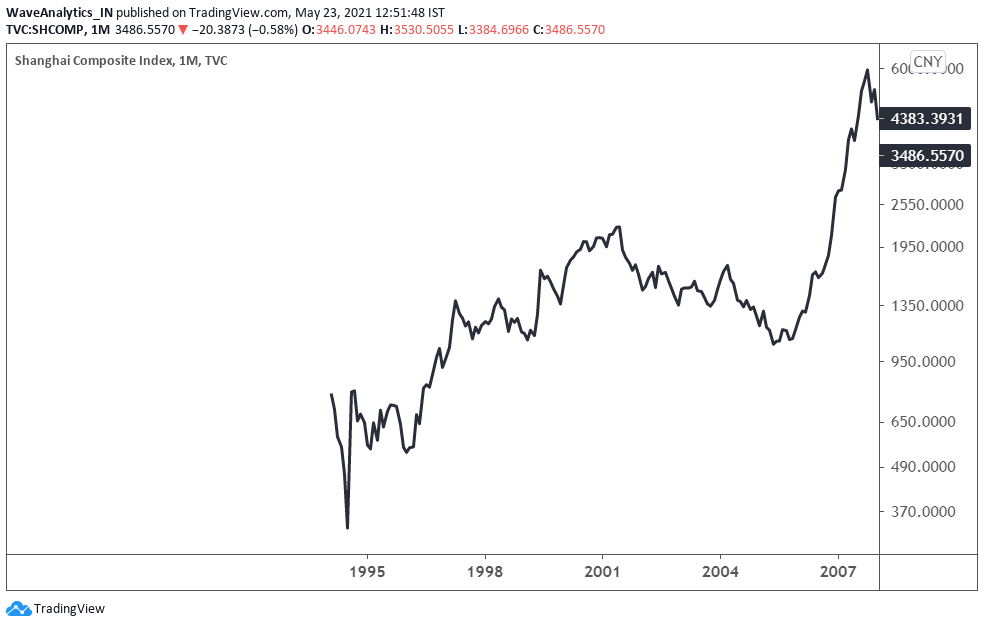
That gave way to China creating deep manufacturing capacity. From less than 3% of global manufacturing output by value (1990), it went on to become the center of the world’s supply chain.
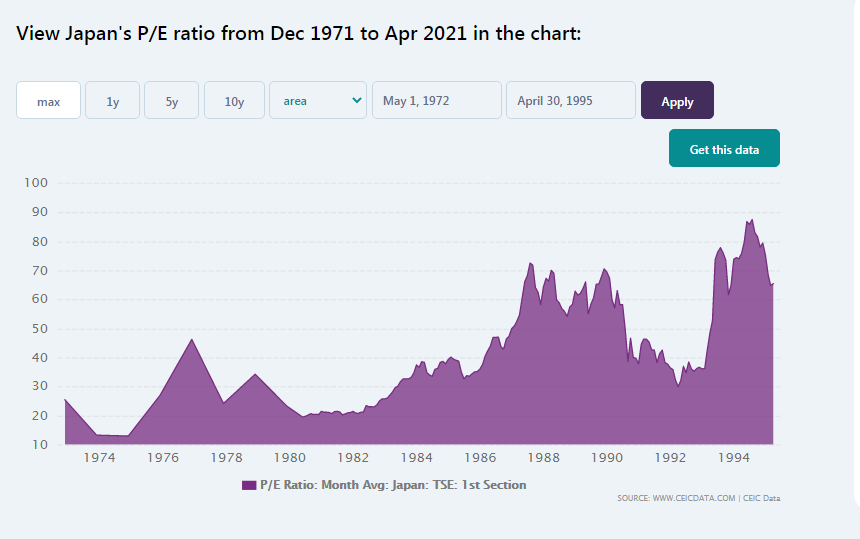
Let’s look at the corresponding bull runs in their respective benchmark indices that primarily were fuelled due to their respective domestic inflows.
(click on images to enlarge)
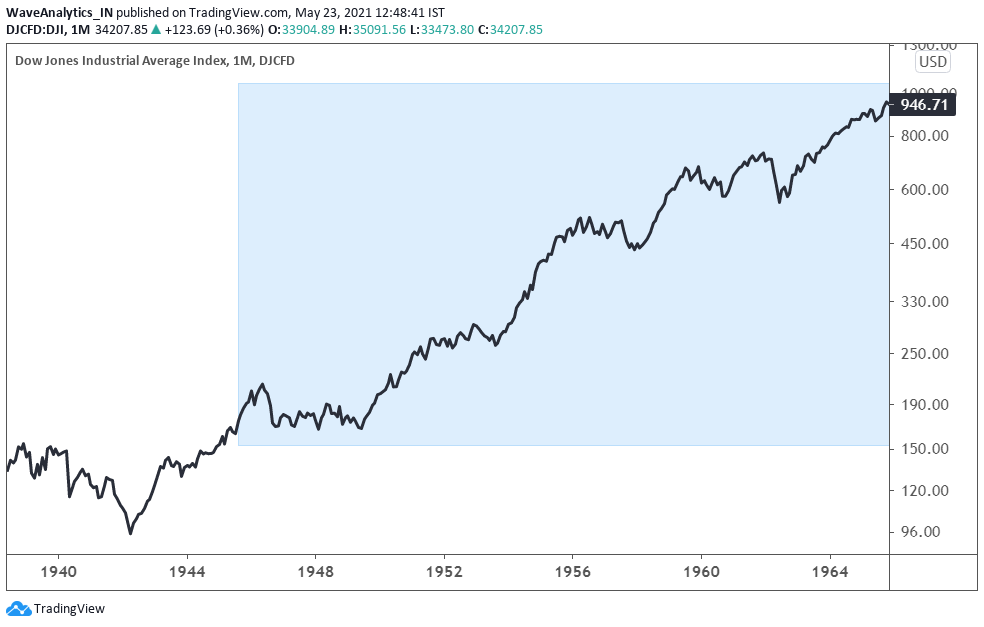

From a single valuation parameter perspective, the P/E's in both Japan and China crossed 60. Though the P/E of DJIA stayed around 20 in 1960's, there were 50 stocks that drove the market – the infamous Nifty Fifty, whose P/E's crossed well above 50.
All parties must end, these were no exceptions.
- The DJIA went into a 17-year correction post 1965.
- Japan corrected in 1991 and never recovered.
- China corrected since 2008.

Which makes me wonder, is India experiencing something along these lines, driven by Socionomics?