Analysing how much risk a fund has taken to generate a return is an important filter which investors should consider while choosing funds.
In this post, we shall explore Fund Risk Measures tool, which gives information on a fund’s metrics such as Alpha, Beta, R square, Sharpe Ratio, Standard Deviation and more.
This feature can be accessed through Tools > Fund Risk Measures Tab on the homepage top navigation.
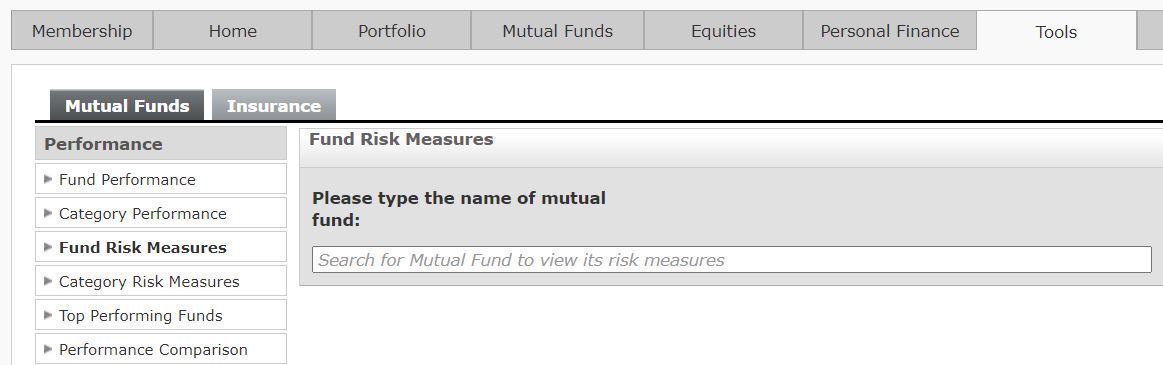
Type the name of the fund in the box above which will take you to this landing page.
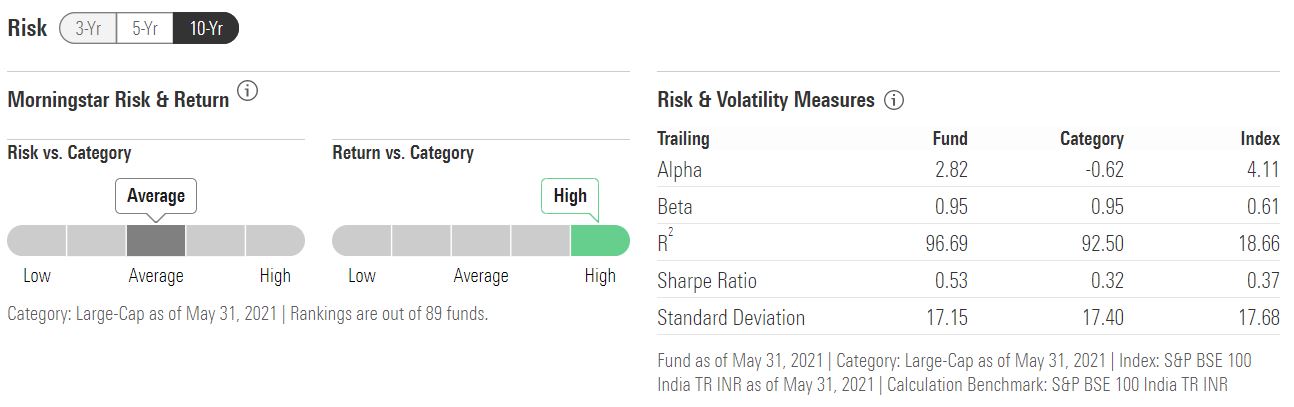
We selected the top performing fund over a ten-year period in the large cap category as on May 16, 2021, which is Mirae Asset Large Cap. On this page, you will see Risk and Volatility measures like Alpha, Beta, R2, Sharpe Ratio and Standard Deviation.
Let’s find out what these terms mean.
Alpha
It is a measure of the difference between a portfolio’s actual returns and its expected performance, given its level of risk as measured by Beta. This is an important measure of gauging an active fund’s performance because they are supposed to perform better relative to their benchmark. The fund’s alpha shows the fund manager’s stock and sector allocation skills. A negative alpha means that the fund has underperformed the benchmark and while a positive alpha means that a fund has performed better than the benchmark on a risk-adjusted basis.
The alpha shown here is Jensen’s alpha. It is calculated as follows:
Alpha = Fund Return – (Risk-free rate + Beta X (Index Return – Risk-Free Rate).
Beta
Beta measures the fund’s sensitivity to market movements. A beta greater than 1 indicates that the fund is more volatile than the market. If beta is less than 1, the fund is less risky compared to the market. Higher beta will eat into the alpha generated by fund the fund manager. If the beta is high, the fund’s return should also be high in order to compensate for the increased risk.
- Beta: Covariance/Variance.
- Covariance: How a fund’s return moves in relation to the market.
- Variance: Average expected return of the market.
R2
R-squared reflects the percentage of a fund’s movement that is explained by movements in its benchmark index. R-squared is reported as 0-100. A fund that has 0 R2 has no correlation with its benchmark while an R-squared of 100 indicates the fund is mirroring the index precisely. A higher R-squared indicates a more useful beta figure.
Standard Deviation
It indicates the volatility of the fund’s returns. Higher standard deviation means higher variation in returns and vice versa. In technical terms, it is a dispersion of returns from the average over a period of time.
It is calculated as follows:

Suppose a fund has delivered: 10.35%, 4%, 9%, 23% over four calendar years.
Sum the returns and divide the result by time period which is 4.
- (10.35%+4%+9%+23%/4) = 11.58.
Find out the squared differences between the mean and the fund’s return for each year.
- (10.35-11.58)2 = 1.51
- (4-11.58)2 = 57.45
- (9-11.58)2 = 6.65
- (23-11.58)2 = 130.42
Now, sum the answers and divide by 4 to find out the variance.
- 51+57.45+6.65+130.42/4 = 49.01
Standard deviation is the square root of variance: 7.
Standard Deviation of Large Cap Funds will be comparatively low as compared to Small Cap Funds, which are susceptible to huge drawdowns. Similarly, the SD of liquid funds will be very less as compared to equity funds. The five-year SD of Mirae Asset Large Cap Fund is 17.15 as on May 31, 2021. On the other hand, the SD of SBI Small Cap Fund during the same period is 25.96. One drawback of SD is that takes into account both negative and positive dispersion from the average. Positive dispersion is desirable while negative dispersion from average is not. So this ratio needs to be compared within the same asset class, fund categories and over a similar time frame.
Sharpe Ratio
A risk-adjusted measure developed by Nobel Laureate William Sharpe that calculates the mean of a fund’s returns over that of the risk-free rate.
The higher the Sharpe Ratio better the fund’s historical risk-adjusted-performance. It indicates the reward per unit of risk by using standard deviation and excess return.
Two funds with a similar return can be compared using the Sharpe Ratio because it discounts the amount of risk each fund had to take in order to earn the return it did.
It is calculated as:
Return of the portfolio – Risk-free rate/Standard Deviation of the fund
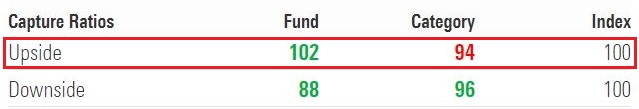
Upside Capture
An upside capture ratio over 100 indicates a fund has outperformed the benchmark during periods of positive returns for the benchmark. In the case of Mirae Asset Large Cap Fund, the 10-year upside capture ratio is 102 which means the fund has performed better than the benchmark by 2% over this period.
It is calculated by taking the fund’s upside capture return and dividing it by the benchmark’s upside capture return.
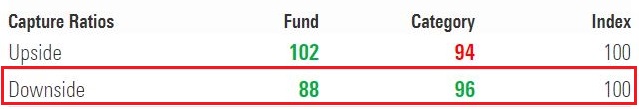
Downside Capture
A downside capture ratio of less than 100 indicates that a fund has lost less than its benchmark in periods when the benchmark has been in the red. Over a ten-year period as of May 2021, the downside capture ratio of Mirae Asset Large Cap Fund is 88, which means the fund has captured 88% of the downside and protected the portfolio by 12% when the benchmark fell.
The ratio is calculated by dividing the manager’s returns by the returns of the index during the down market and multiplying the result by 100.
The below image shows the risk-return characteristics of Mirae Asset Large Cap Fund. It shows that the fund has delivered a higher return in comparison to other funds in the category over a ten-year period. The fund’s risk within the Large Cap category is average. This means the fund has delivered a higher return while taking a lower risk.

You cannot base your decision to invest in a fund just based on one risk parameter. Each risk measure tells something about the fund. Each data should be compared during a similar time period with the same category of funds.
The funds mentioned in the article are merely for illustration purposes.