Standard deviation is a widely used metric to ascertain the investment risk of mutual funds.
The concept of Standard Deviation becomes important when you invest in a market-linked product like mutual fund. This is because the returns of a fund vary every day depending on a variety of factors. In contrast, the returns on a bank fixed deposit are fixed and certain so there is no question of variability in returns.
Standard Deviation indicates the volatility of the fund’s returns. Higher standard deviation means higher variation in returns and vice versa. In technical terms, it is a dispersion of returns from the average over a period of time. Generally, it is calculated using trailing monthly total returns for 3, 5 or 10 years. All the monthly standard deviations are annualized and expressed as a percentage.
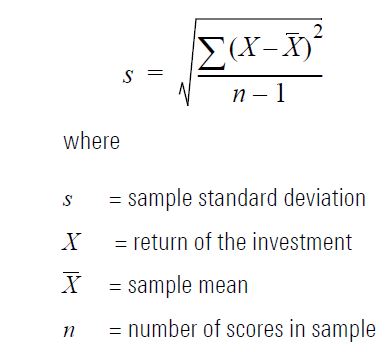
Formula

Suppose Fund A and Fund B have both delivered 13% CAGR over a 3-year period. Fund A has SD of 22 while Fund B has SD of 17. An investor who would prefer a less bumpy ride would choose Fund B.
Here’s how SD is calculated on Excel.

STEPS:
- Add the yearly returns and divide the answer by 5. You will get a mean of 8.71
- Subtract each year’s return from this mean. (For instance, 10.35-8.71 = 1.64)
- Square the answer for each year. (1.64^2) = 2.69
- Sum the squared differences and divide by 5 (377.38/5 = 75.48)
- Square root of 75.48 is 8.68
Standard Deviation differs across categories and funds
Standard Deviation of Large Cap Funds will be comparatively lower as compared to Small Cap Funds, which are susceptible to huge drawdowns. For instance, the five-year SD of Mirae Asset Large Cap Fund is 17.15 as on May 31, 2021. On the other hand, the SD of SBI Small Cap Fund during the same period is 25.96. Similarly, the SD of liquid funds will be comparatively lower as compared to equity funds.
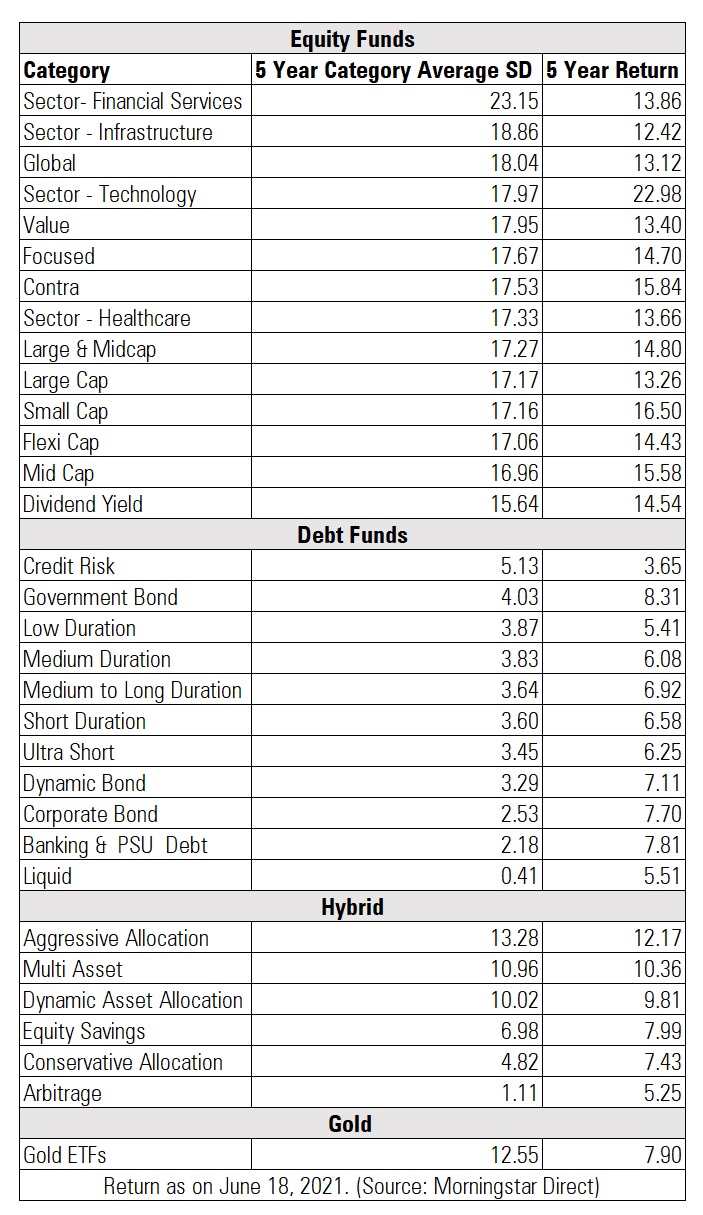
As you can see in the table below, the Standard Deviation of equity funds is higher as compared to debt funds. Within debt funds, the SD of Liquid Fund will be lower in comparison to Dynamic Bond Fund which takes duration bet, or Gilt Fund which is susceptible to interest rate risk.

How should you interpret it?
One drawback of SD is that takes into account both negative and positive dispersion from the average. This means that returns that are above average will increase the SD the same way as returns that are below the average. Thus, SD punishes positive performance as well. The standard deviation tends to be lower over a longer period of time as compared to shorter time periods.
Positive dispersion is desirable while negative dispersion from average is not. So this ratio needs to be compared within the same asset class, fund categories and over a similar time frame. Higher SD does not necessarily mean that a fund is good or bad. A fund that has delivered extraordinary returns can have a high SD. In contrast, a fund that has a wide negative return from the mean will also have a high SD. Thus, it needs to be looked at in conjunction with other ratios/metrics like Sortino Ratio, Sharpe Ratio, Upside Capture Ratio, Downside Capture Ratio, Alpha, Beta and R2.