We are suddenly getting queries about whether it is the right time to invest in small-cap funds or whether one should book profits in them. To get a perspective, read Small-cap funds on a roll. While buy and sell decisions are to be based on numerous factors, we felt it is a good time to revisit research we conducted in 2021 and 2022.
When it comes to a volatile equity class such as equity, you need to have a very long-term perspective. Let me resort to the rather worn-out cliché that what really matters is “time in the market” rather than “timing the market”.
Or, let me put it another way.
Over the long haul, the stock market's outperformance over cash boils down to just a few critical months. Miss those months and you lost heavily. Why? Because no one knows the day or the hour when outperformance will strike. Stay invested.
How did we arrive at this conclusion?
Our research looked at two 10-year periods.
- March 2011 to February 2021
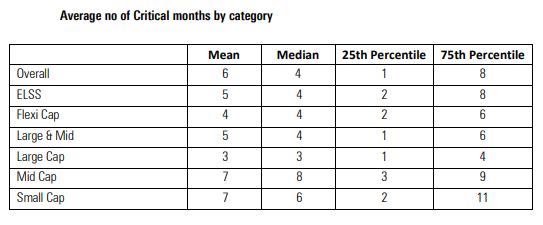
Indian stocks owed their outperformance over cash to just 8 months (6.7% of all months). Similar numbers were witnessed for actively managed equity funds, where on an average just 6 months (5% of all months) accounted for their outperformance versus their benchmarks.
Indian stocks owed their outperformance over cash to just 11 months (9.2% of all months). If you held stocks for all 109 months apart from those 11 months, which we will call critical months, you would not have beaten cash. On an average, outperformance of Indian actively managed diversified equity funds was attributable to just 6 months (5% of all months), although this number varies across categories.
This is not just an Indian phenomenon. In a global study released by Morningstar in 2019, similar trends existed for U.S. large-cap stocks for investments since 1926, where 5% of the months attributed for the overall outperformance over cash.
In data we trust.
Here are the statistics for critical months, first in aggregate and then grouped by fund category. Whether it's mean, median, or the top- and bottom quartile breakdowns, these numbers should give little comfort to investors who try to find the best times to buy and sell actively managed funds.
In aggregate, the median number of critical months was four. That means that half of the funds' outperformance was due to four or fewer months. One in four funds (25th percentile) owed their outperformance to only one month!! Finally, three fourths (75th percentile) of all the funds' outperformance was attributable to 8 or fewer months. Mid-cap funds were the best of the pack, while funds with a large-cap bias came in with the poorest results.

The Implications.
- Trying to time the market is often counterproductive, at best, and hazardous at worst.
- When investing in stocks, one does look at the price with respect to the perceived intrinsic value. That is the margin of safety investors must adhere to. When it comes to investing in equity mutual funds, don’t try to time your investments. Let the fund manager do that with respect to the stocks being bought or sold.
- Once you have your asset allocation in place, staying invested is the name of the game. Identify funds to invest in, and stay put.
- Investing based on recent performance often backfires, resulting in missing of critical months of performance in both the newly invested fund(s) as well as the exited fund(s).
- If you think you have identified a skilled manager, the best course of action is to buy in or rupee cost average, regardless of the moment, and hold on to the fund over long periods of time. It may take a long time before critical months Thus, don't sell based on the “what have you done for me lately” rationale.
How we arrived at Critical Months.
Critical Months are those months whose removal from the return series would eliminate the fund's outperformance over its benchmark.
We find this by calculating geometric excess return of a fund over the category index for all months. Geometric excess returns are multiplicative, so that the geometric excess return over the whole period is the product of all the months' excess returns. So, we remove, one by one, the month with the highest excess returns, the second-highest excess return, and so on until no excess return over the whole period remains.
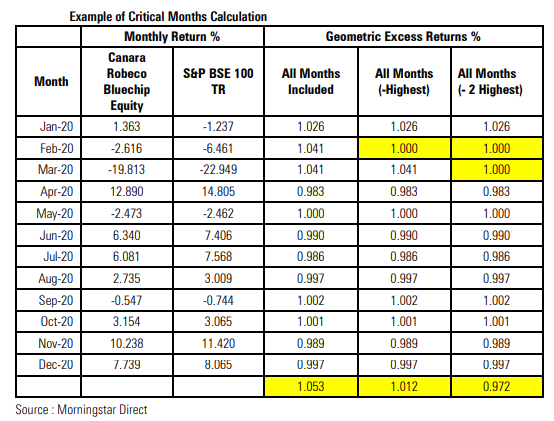
We examine a real-life example, Canara Robeco Bluechip Equity Fund, the best performing large-cap fund in CY20. Over the 12 months ending December 2020 the fund outperformed its category benchmark, the S&P BSE 100 TR, by 6.21% in absolute terms and 5.32% (in geometric excess return terms, which we show here as 1.0532; outperformance in geometric terms means >1).
The columns titled "All Months Included" are the geometric excess returns for each month (defined as (1+FundReturn/100)/(1+IndexReturn/100). The bottom row shows the geometric excess return over the whole period, which is just the product of multiplying all the months' numbers above it. In the next column, we remove the highest geometric return, February 2020, keeping all others intact (in geometric terms this removal means setting that month's excess return to 1, as if the fund just matched the index in that month). We see in the Geometric Excess Return row that the removal of that month's excess return brings down the whole period's (less that one month) geometric excess return to 1.2% (1.012). However, when we then take out the second-highest excess return too, (February 2020 and March 2020), the excess return for the whole period turns negative (0.972 = - 2.8% geometric excess return).
This is how we define Critical Months. Their number is dependent on the time period under consideration. For this particular fund, the number of critical months was two over the 12-month period we considered. These were the two months out of 12 that accounted for all the fund's outperformance over its benchmark.

DISCLAIMER
© 2023 Morningstar. All rights reserved. The Morningstar name is a registered trademark of Morningstar, Inc. in India and other jurisdictions. This research on securities (“Investment Research”), is issued by Morningstar Investment Adviser India Private Limited. Morningstar Investment Adviser India Private Limited (CIN: U74120MH2013FTC249024), having its registered office at Platinum Technopark, 9th Floor, Plot No 17 & 18, Sector - 30A, Vashi, Navi Mumbai, Maharashtra, 400705, is registered with SEBI as an investment adviser (registration number INA000001357), portfolio manager (registration number INP000006156), and research entity (registration number INH000008686).
Morningstar Investment Adviser India Private Limited has not been the subject of any disciplinary action by SEBI or any other legal/regulatory body. It is a wholly owned subsidiary of Morningstar Investment Management LLC, which is a part of the Morningstar Investment Management group of Morningstar, Inc. In India, Morningstar Investment Adviser India Private Limited has only one associate, viz., Morningstar India Private Limited, and this company predominantly carries on the business activities of providing data input, data transmission and other data related services, financial data analysis, software development etc.
The author/creator of this Investment Research (“Research Analyst”) or his/her associates or immediate family may have (i) a financial interest in the subject mutual fund scheme(s) or (ii) an actual/beneficial ownership of one per cent or more securities of the subject mutual fund scheme(s), at the end of the month immediately preceding the date of publication of this Investment Research. The Research Analyst, his/her associates and immediate family do not have any other material conflict of interest at the time of publication of this Investment Research. The Research Analyst or his/her associates or his/her immediate family has/have not received any (i) compensation from the relevant asset manager(s)/subject mutual fund(s) in the past twelve months; (ii) compensation for products or services from the relevant asset manager(s)/subject mutual fund(s) in the past twelve months; and (iii) compensation or other material benefits from the relevant asset manager(s)/subject mutual fund(s) or any third party in connection with this Investment Research. Also, the Research Analyst has not served as an officer, director or employee of the relevant asset manager(s)/trustee company/ies, nor has the Research Analyst or associates been engaged in market making activity for the subject mutual fund(s).
The terms and conditions on which Morningstar Investment Adviser India Private Limited offers Investment Research to clients varies from client to client, and are spelt out in detail in the respective agreement. The Investment Research: (1) includes the proprietary information of Morningstar, Inc. and its affiliates, including, without limitation, Morningstar Investment Adviser India Private Limited; (2) may not be copied, redistributed or used, by any means, in whole or in part, without the prior, written consent of Morningstar Investment Adviser India Private Limited; (3) is not warranted to be complete, accurate or timely; and (4) may be drawn from data published on various dates and procured from various sources. No part of this information shall be construed as an offer to buy or sell any security or other investment vehicle. Neither Morningstar, Inc. nor any of its affiliates (including, without limitation, Morningstar Investment Adviser India Private Limited, nor any of their officers, directors, employees, associates or agents shall be responsible or liable for any trading decisions, damages or other losses resulting directly or indirectly from the use of the Investment Research. Investments in securities market are subject to market risks. Read all the related documents carefully before investing. Wherever any securities are quoted, they are quoted for illustration only and are not recommendatory. Registration granted by SEBI and certification from NISM in no way guarantee performance of the intermediary or provide any assurance of returns to investors.
The Morningstar Medalist Rating is the summary expression of Morningstar’s forward-looking analysis of investment strategies as offered via specific vehicles using a rating scale of Gold, Silver, Bronze, Neutral, and Negative. The Medalist Ratings indicate which investments Morningstar believes are likely to outperform a relevant index or peer group average on a risk-adjusted basis over time. Investment products are evaluated on three key pillars (People, Parent, and Process) which, when coupled with a fee assessment, forms the basis for Morningstar’s conviction in those products’ investment merits and determines the Medalist Rating they’re assigned. Pillar ratings take the form of Low, Below Average, Average, Above Average, and High. Pillars may be evaluated via an analyst’s qualitative assessment (either directly to a vehicle the analyst covers or indirectly when the pillar ratings of a covered vehicle are mapped to a related uncovered vehicle) or using algorithmic techniques. Vehicles are sorted by their expected performance into rating groups defined by their Morningstar Category and their active or passive status. When analysts directly cover a vehicle, they assign the three pillar ratings based on their qualitative assessment, subject to the oversight of the Analyst Rating Committee, and monitor and re-evaluate them at least every 14 months. When the vehicles are covered either indirectly by analysts or by algorithm, the ratings are assigned monthly.
For more detailed information about the Medalist Ratings, including their methodology, please go to the section titled “Methodology Documents and Disclosures” at http://global.morningstar.com/managerdisclosures.